Data Analysis
(1) Demultiplexing
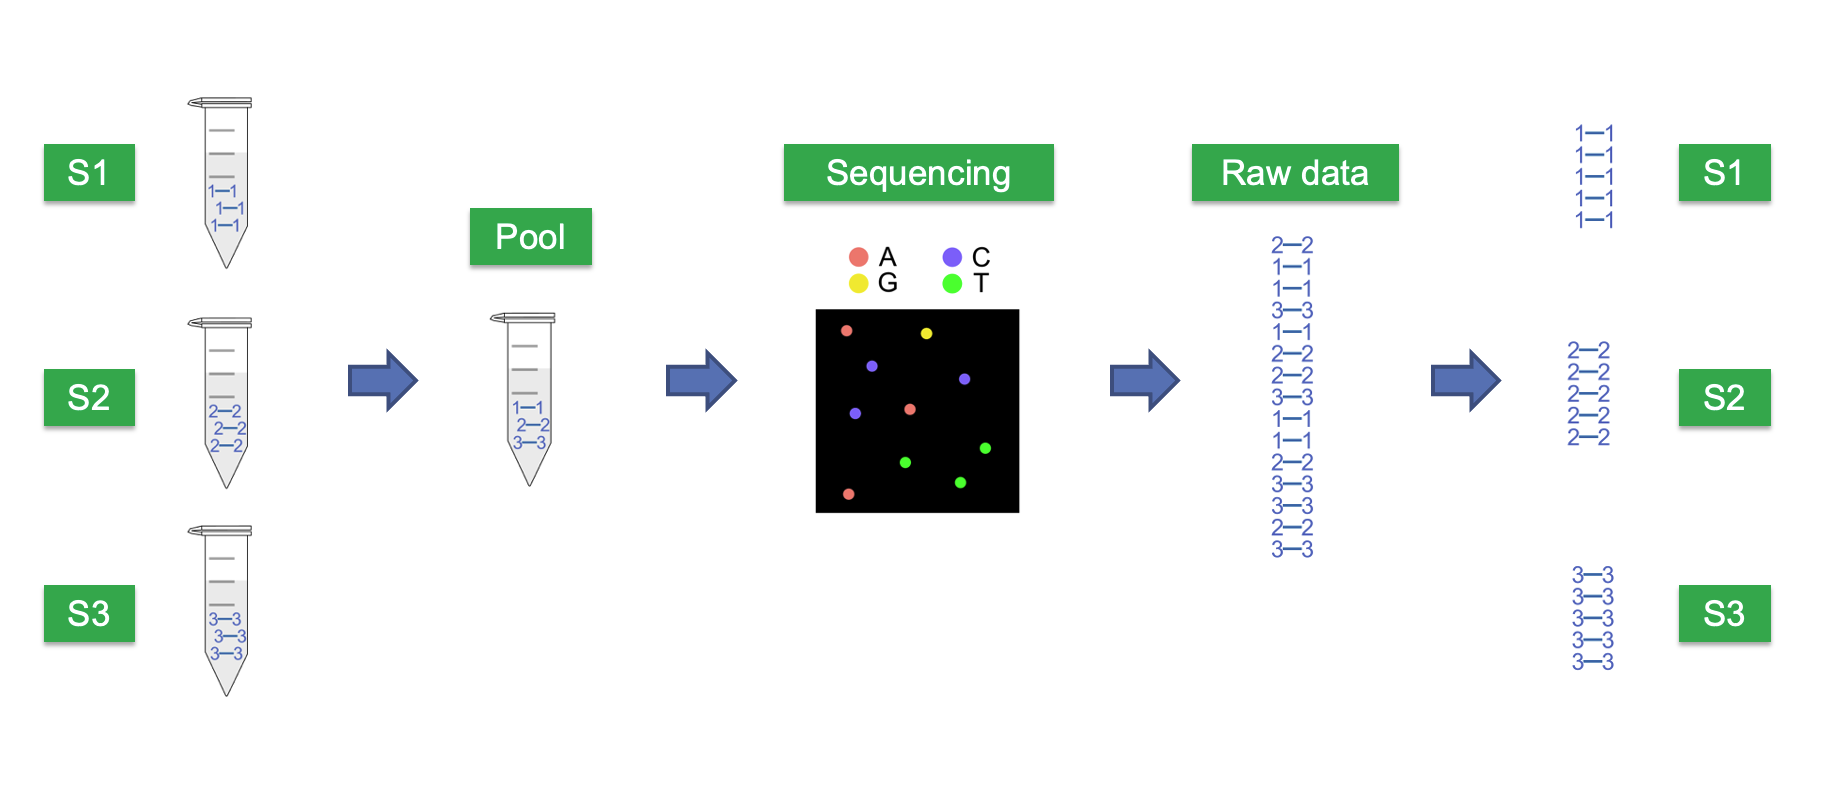
Every sequencing run pools many samples together, each tagged in the lab with a unique index sequence. Demultiplexing sorts the raw, mixed read pool back into per-sample files by matching these indices, usually requiring both a forward and reverse index to agree. This guards against index hopping, where reads get misassigned between samples and create false detections. Reads with no confident index match are set aside as undetermined rather than discarded blindly. The output is a traceable set of per-sample FASTQ files, still containing primers and adapters, ready for further processing.
(3) Primer trimming
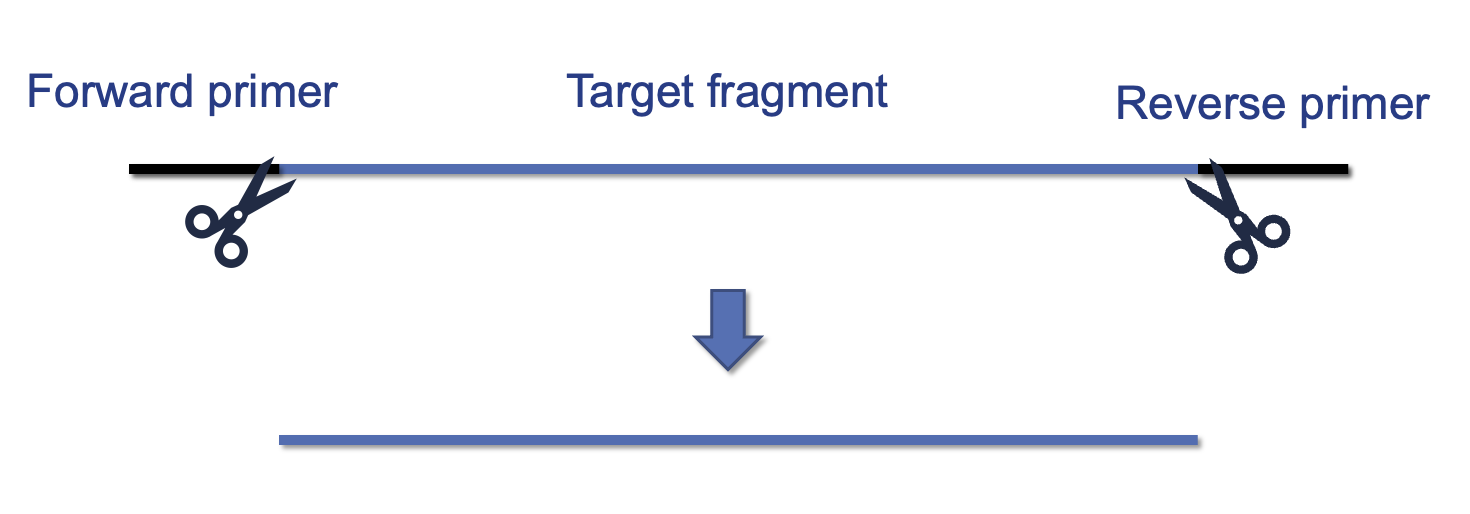
Every read still carries the PCR primer sequence at its ends, since primers are physically incorporated during amplification. Primer trimming removes these, leaving only the true biological insert. This matters because degenerate primer bases aren't real biological signal and can distort clustering and taxonomy if left in.
(5) Clustering
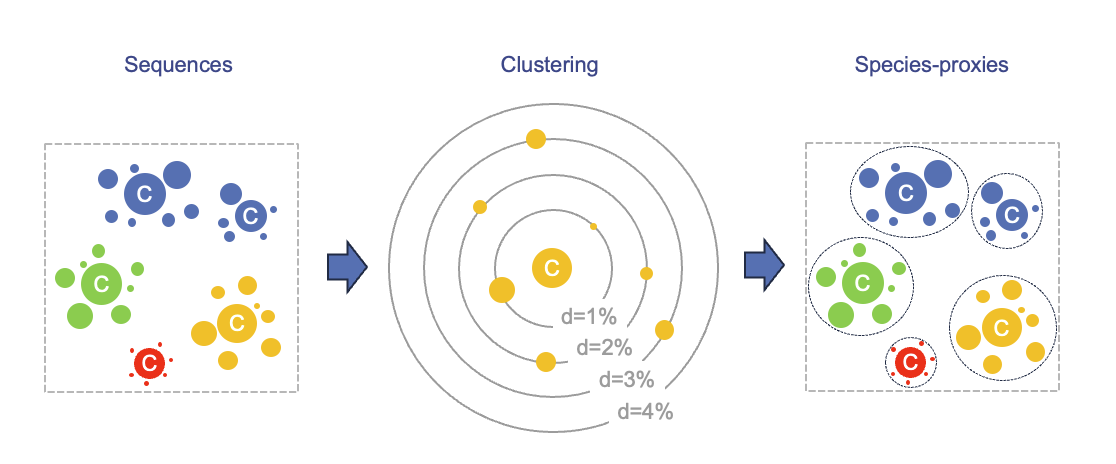
With clean reads in hand, similar sequences must be grouped into biologically meaningful units. Conventional Operational Taxonomic Units (OTU) clustering groups reads by percentage similarity (often 97%), which can be regarded as species proxies. This includes chimera removal, filtering out hybrid artifacts formed during PCR, and produces a feature table of OTUs with per-sample abundances and representative sequences, ready for taxonomic classification.
(7) Taxonomic assignment
Each representative sequence is compared against a reference database to infer its taxonomic identity. Classifiers report confidence at each rank, so assignment stops wherever the evidence runs out rather than forcing false species-level precision. Results are only as good as the reference database itself: gaps there mean no match, or a misleadingly confident wrong one.
(9) Data analyses
The annotated and cleaned feature table becomes the basis for ecological interpretation: diversity metrics (alpha, beta, and gamma diversity), ordination and statistical tests of community differences, and for applied biomonitoring, translation into standardized ecological status classifications under frameworks like the Water Framework Directive or GBF. Results are cross-checked against independent ecological knowledge before being trusted. Every conclusion here depends on the integrity of each upstream step, from demultiplexing onward.
(2) PE-merging
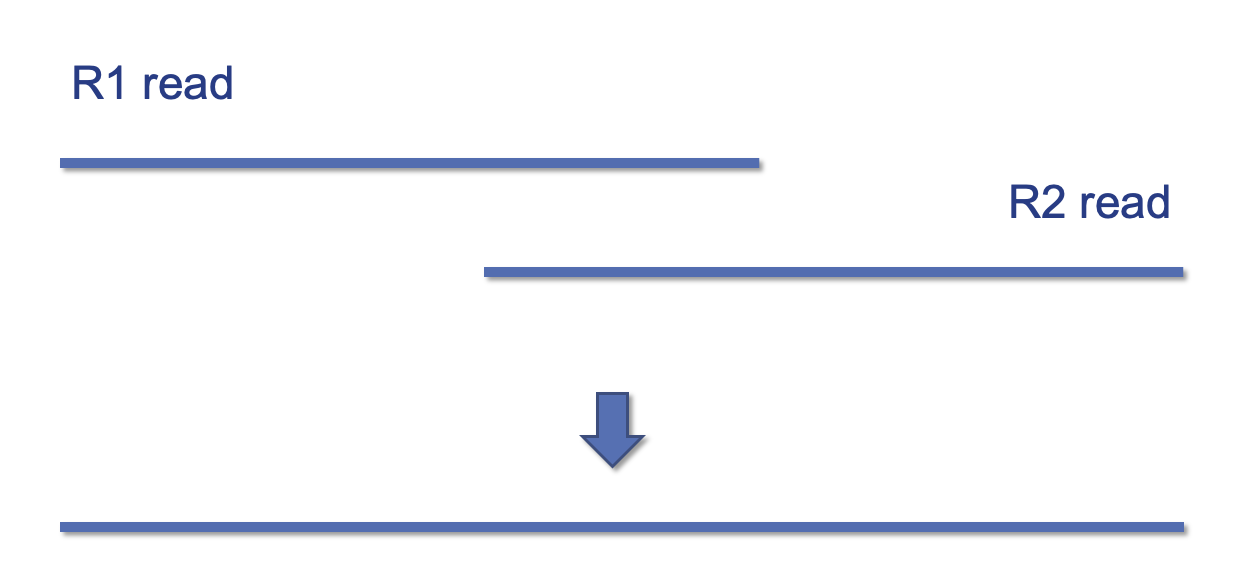
Paired-end sequencing reads each DNA fragment from both ends, producing overlapping forward and reverse reads. PE-merging combines this overlap into one high-confidence consensus sequence.
(4) Quality and length filtering
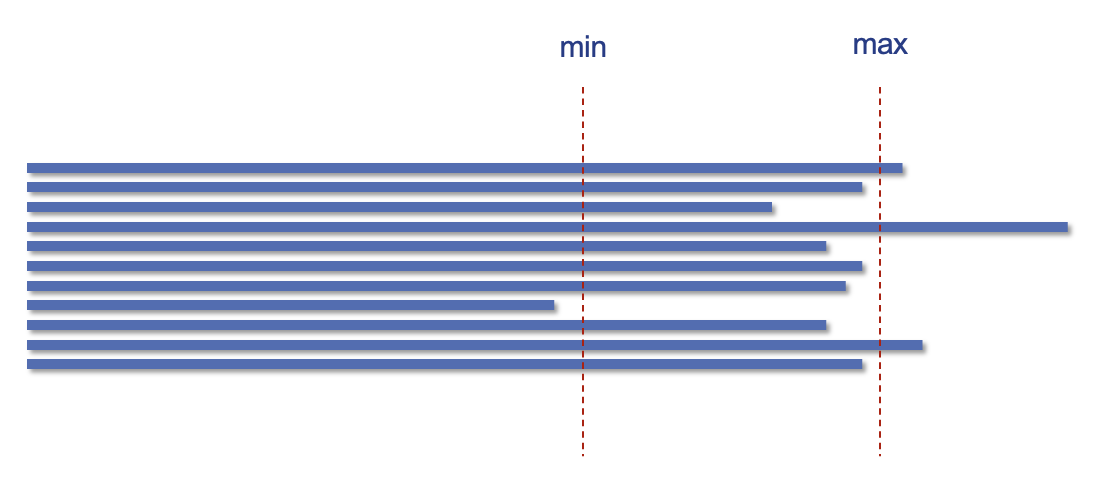
Each base call carries a quality score reflecting its error probability. Quality filtering removes reads whose total expected errors, length, or ambiguous ("N") bases fall outside defined thresholds. Additionally, sequences are filtered based on their length, discarding sequences that are either too short or too long.
(6) Denoising
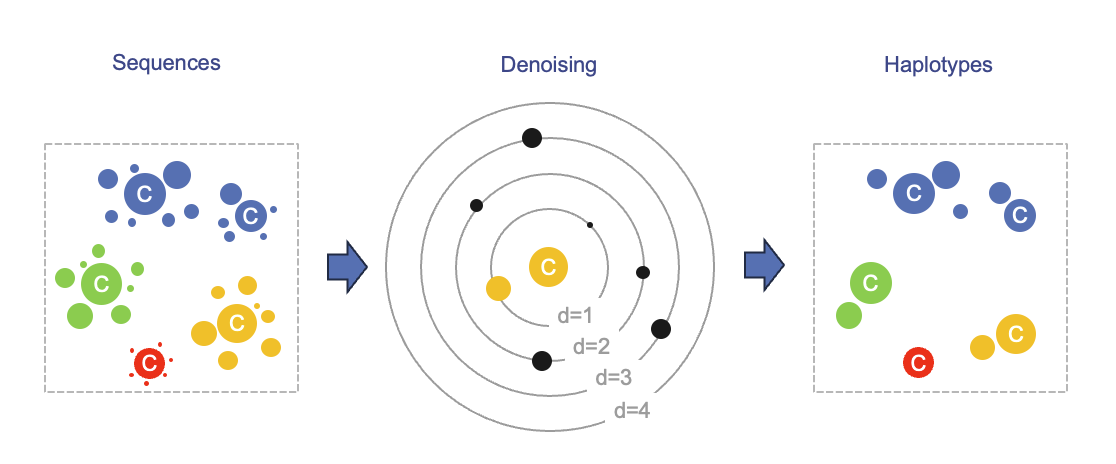
Denoising of Exact Sequence Variants (ESVs) instead models sequencing error directly to resolve exact, reproducible sequence variants without an arbitrary threshold, which can be regarded as haplotypes or genetic variants. Like OTU clustering, it includes chimera removal to filter out hybrid PCR artifacts, producing a feature table of ESVs with per-sample abundances and representative sequences, ready for taxonomic classification.
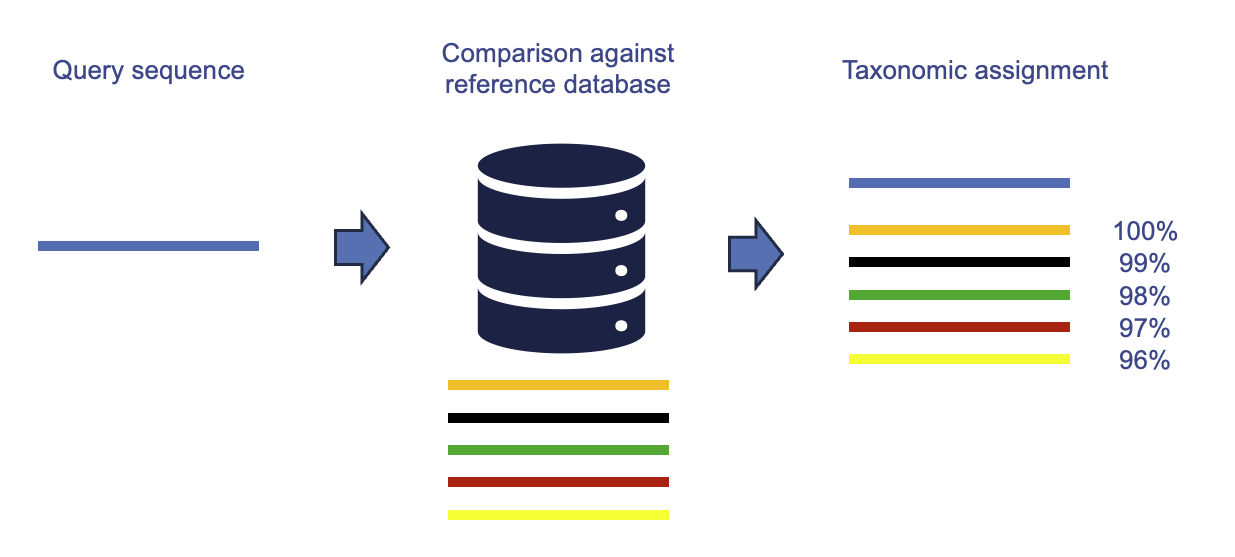
(8) Data validation and filtering
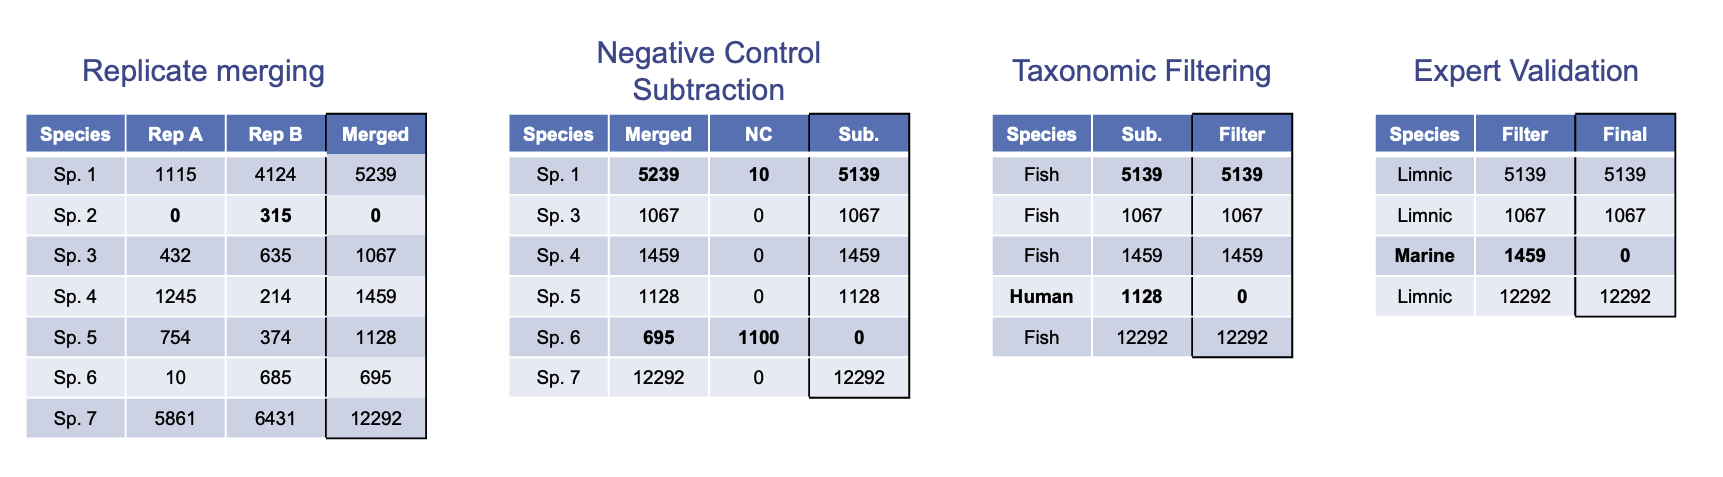
Further processing refines the feature table into a defensible result. PCR or extraction replicates are merged, typically keeping only taxa detected across multiple replicates to guard against stochastic dropout. Read counts from negative controls are then subtracted, removing background contamination and cross-contamination signal from true samples. Taxonomic filtering removes non-target groups, such as human, livestock or known lab contaminants, restricting results to taxa the assay was designed to detect. Finally, an expert reviews ambiguous or ecologically implausible detections before results are reported.
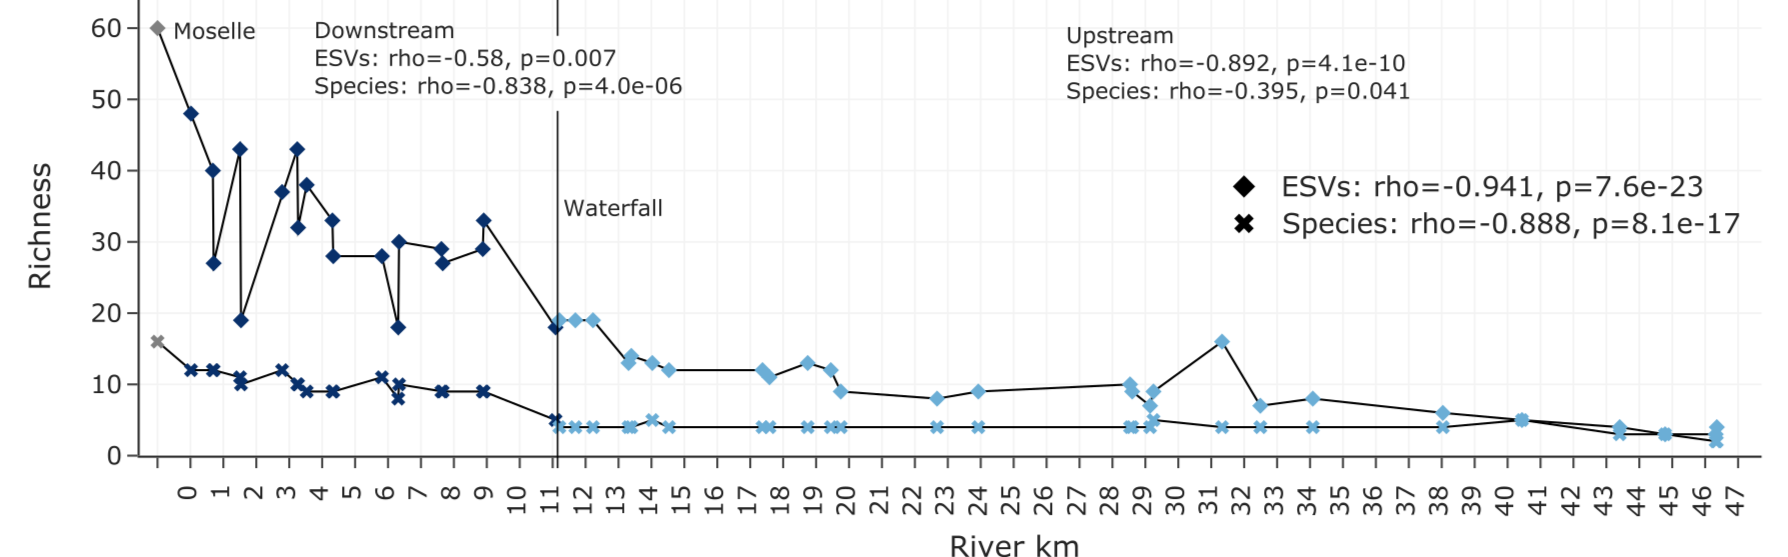
(10) Reporting (FAIR & MIEM)
None of this holds value unless it can be trusted and reused. Results are reported following MIEM guidelines (Klymus et al., 2024), ensuring sample collection, protocols, filtering thresholds, and taxonomic decisions are recorded in enough detail for others to evaluate or replicate the work. Data and metadata are made FAIR (Wilkinson et al., 2016): findable, accessible, interoperable, and reusable, turning a single dataset into a lasting resource that can be verified, compared, and built upon by others.
💧 A Pile of Pipelines 🧬
APSCALE
APSCALE is our core pipeline for turning raw data into clean, ready-to-use species tables. It handles every step in between, quality filtering, primer trimming, and clustering millions of raw DNA reads into reliable operational taxonomic units, all through a simple, reproducible workflow. Designed to be accessible to non-bioinformaticians as well as experts, APSCALE forms the computational backbone linking water samples to biodiversity datasets.
APSCALE-BLAST
APSCALE-BLAST extends this pipeline with fast, automated taxonomic assignment. Once DNA sequences have been clustered, this tool matches them against public and custom reference databases, translating anonymous genetic barcodes into named species, families, or genera. Built for speed and scalability, it allows thousands of sequences to be reliably identified at once, keeping pace with the growing volume of eDNA data generated in modern biodiversity monitoring.
APSCALE-Nanopore
APSCALE-Nanopore adapts our pipeline to portable, long-read Nanopore sequencing technology, which comes with higher error rates but the advantage of near real-time, field-deployable analysis. By accounting for these technical differences, this tool brings the same rigorous species-detection workflow to remote fieldwork, opening the door to on-site biodiversity assessments without needing to ship samples back to a central laboratory.
TaxonTableTools2
TaxonTableTools2 is our platform for exploring and interpreting the species tables that APSCALE produces. It offers interactive filtering, visualization, and statistical analysis, from diversity indices to community comparisons, without requiring any coding knowledge. Built for ecologists and non-specialists alike, it turns raw taxonomic data into clear figures and summaries, making eDNA results genuinely usable for research, conservation, and monitoring.

dbSCORE
Reliable species identification depends on trustworthy reference sequences, yet public databases lack systematic quality control, causing conflicting or incorrect taxonomic assignments. dbSCORE rates reference sequences on expert verification, taxonomic concordance, sequence quality, and metadata completeness, scoring from -20 to 50 and grading each gold, silver, bronze, or unreliable. Ratings feed into curated, versioned reference databases for score-aware taxonomic assignment.
EDIX
EDIX, the Environmental DNA Index, is our data-driven ecological indicator, translating eDNA-derived biodiversity signals into a single, interpretable measure of ecosystem health. Combining molecular data on species presence, abundance, and physiological state with environmental variables, EDIX supports the kind of standardized, comparable assessments long used in regulatory monitoring, bringing modern molecular tools into practical, real-world water-quality evaluation.